Page 4 - Hedengren_annual_review_2019_final_EN
P. 4

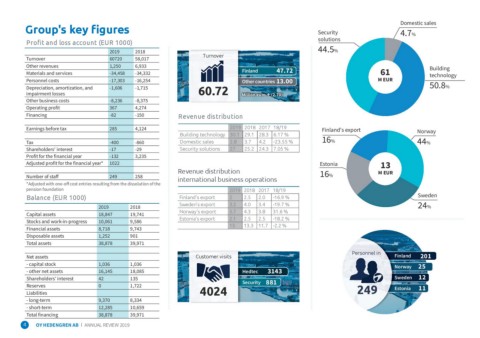
Group's key figures                                                                                                    Security                 Domestic sales
                                                                                                                       solutions
Profit and loss account (EUR 1000)                                                                                                              4.7%
                                                                                                                       44.5%
                                         2019     2018                       Turnover
Turnover                                 60720    58,017                                        Finland  47.72                           61     Building
Other revenues                           1,250    6,933                    60.72                                                                technology
Materials and services                   -34,458  -34,332                                       Other countries 13.00                    M EUR
Personnel costs                          -17,303  -16,254                                                                                       50.8%
Depreciation, amortization, and          -1,606   -1,715
impairment losses                                                                               Million euro ↑ (2.70)
Other business costs                     -8,236   -8,375
Operating profit                         367      4,274                    Revenue distribution
Financing                                -82      -150

Earnings before tax                      285 4,124                         Building technology  2019 2018 2017 18/19   Finland's export         Norway
                                                                           Domestic sales       30.1 29.1 28.3 6.17 %
Tax                                      -400     -860                     Security solutions   2.8 3.7 4.2 -23.55 %   16%                      44%
Shareholders' interest                   -17      -29                                           27 25.2 24.3 7.05 %
Profit for the financial year            -132     3,235                                                                                         Sweden
Adjusted profit for the financial year*  1022
                                                                                                                       Estonia           13     24%
Number of staff                          249 258                           Revenue distribution
                                                                           international business operations           16%               M EUR

*Adjusted with one-off cost entries resulting from the dissolution of the                       2019 2018 2017 18/19
pension foundation                                                                              2 2.5 2.0 -16.9 %
                                                                                                3.2 4.0 3.4 -19.7 %
Balance (EUR 1000)                                                         Finland's export     5.7 4.3 3.8 31.6 %
                                                                           Sweden's export      2.1 2.5 2.5 -18.2 %
Capital assets                   2019             2018                     Norway's export      13 13.3 11.7 -2.2 %
Stocks and work-in-progress      18,847           19,741                   Estonia's export
Financial assets                 10,061           9,586
Disposable assets                8,718            9,743
Total assets                     1,252            901
                                 38,878           39,971

Net assets                                                                 Customer visits                                        Personnel in  Finland 201
- capital stock                                                                                                                                 Norway 25
- other net assets               1,036            1,036                    4024                 Hedtec 3143                        249          Sweden 12
Shareholders' interest           16,145           18,085                                        Security 881                                    Estonia 11
Reserves                         42               135
Liabilities                      0                1,722
- long-term
- short-term                     9,370            8,334
Total financing                  12,285           10,659
                                 38,878           39,971

4 OY HEDENGREN AB I ANNUAL REVIEW 2019
   1   2   3   4   5   6   7   8